
Filter and interpret Analytics
Scope Analytics by time, team, and service; interpret SLA and response metrics; and investigate unexpected values.
Before you begin
Define the reporting question, time window, team/service scope, and comparison source. Ensure the user can read the underlying incidents.
Open the feature
Open Analytics from the application navigation.
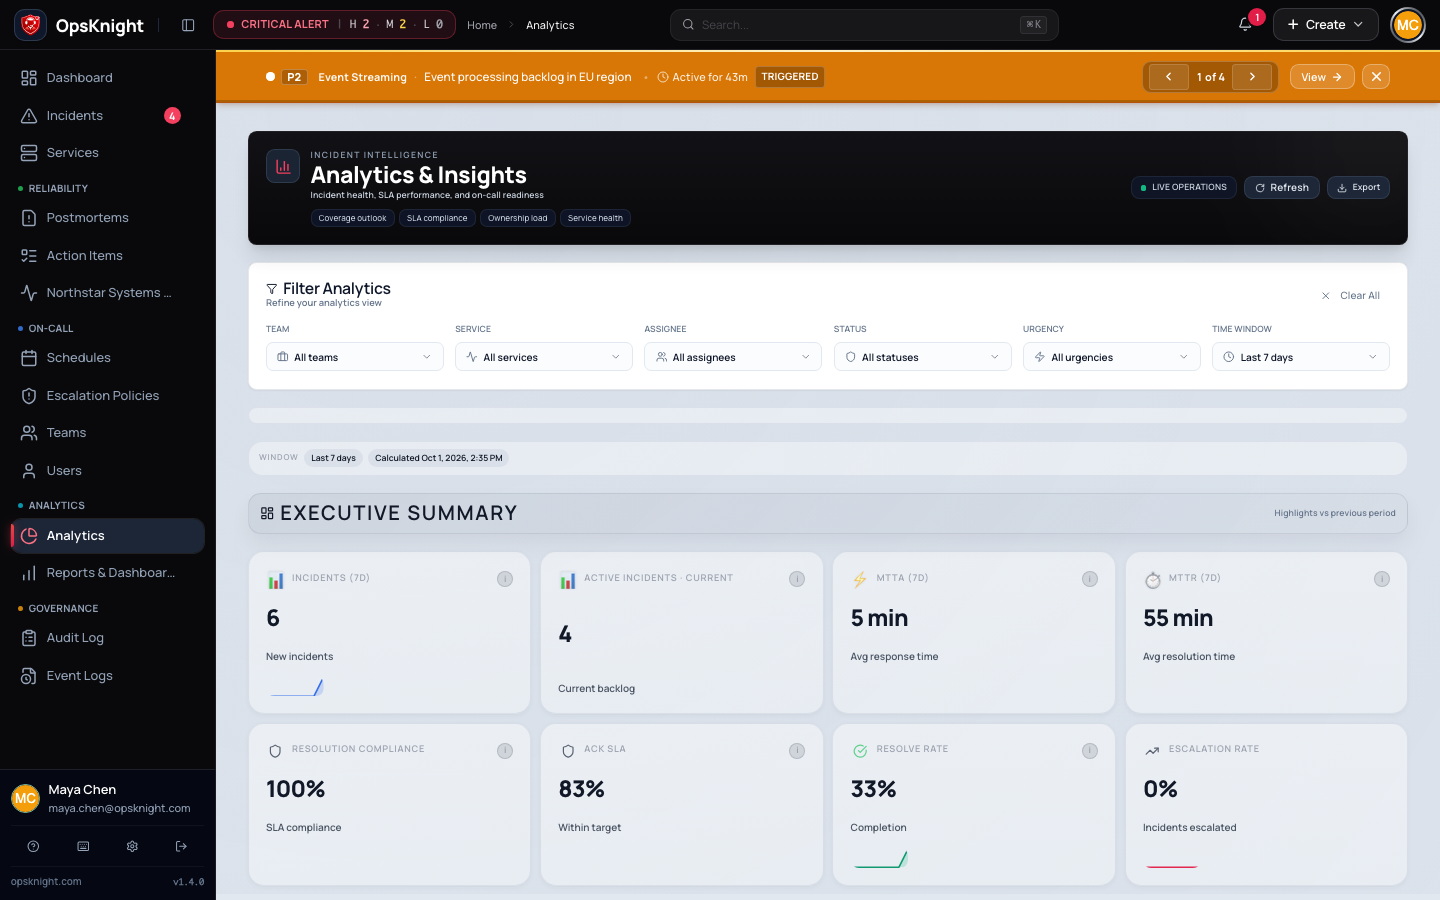
Configure the scope
- Select the required time range.
- Choose a team, then a service when narrower scope is required.
- Record the active filters before quoting a result.
- Review incident volume, active/resolved state, MTTA, MTTR, SLA panels, distributions, and service/team breakdowns that apply to the question.
- Use the available export action only after verifying the scope and values.
How Analytics works
Metrics are computed from records the current actor may read. Counts, duration metrics, and compliance percentages have different populations. An empty or undefined duration can mean no qualifying acknowledged/resolved incident, not a calculation failure.
Verify the result
Cross-check incident counts against the incident list with the same filters. Inspect sample incident timestamps for MTTA/MTTR and confirm the SLA denominator in the metrics reference before reporting a percentage.
Remove or undo filters
Restore All teams, All services, and the default time window. Filtering does not modify incidents or saved dashboards.
Troubleshooting
- Empty panel: widen the window and clear incompatible team/service scope.
- Unexpected count: compare authorization and incident-list filters.
- MTTR undefined: confirm resolved incidents with valid timestamps exist.
- SLA differs from expectation: inspect urgency/SLA policy and qualifying population.
- Export differs: regenerate after the visible scope has finished loading.
Next steps
Last updated for v2.0.0
Edit this page on GitHub