
Use the Health Center
Interpret runtime readiness, dependencies, workers, queues, and provider health.
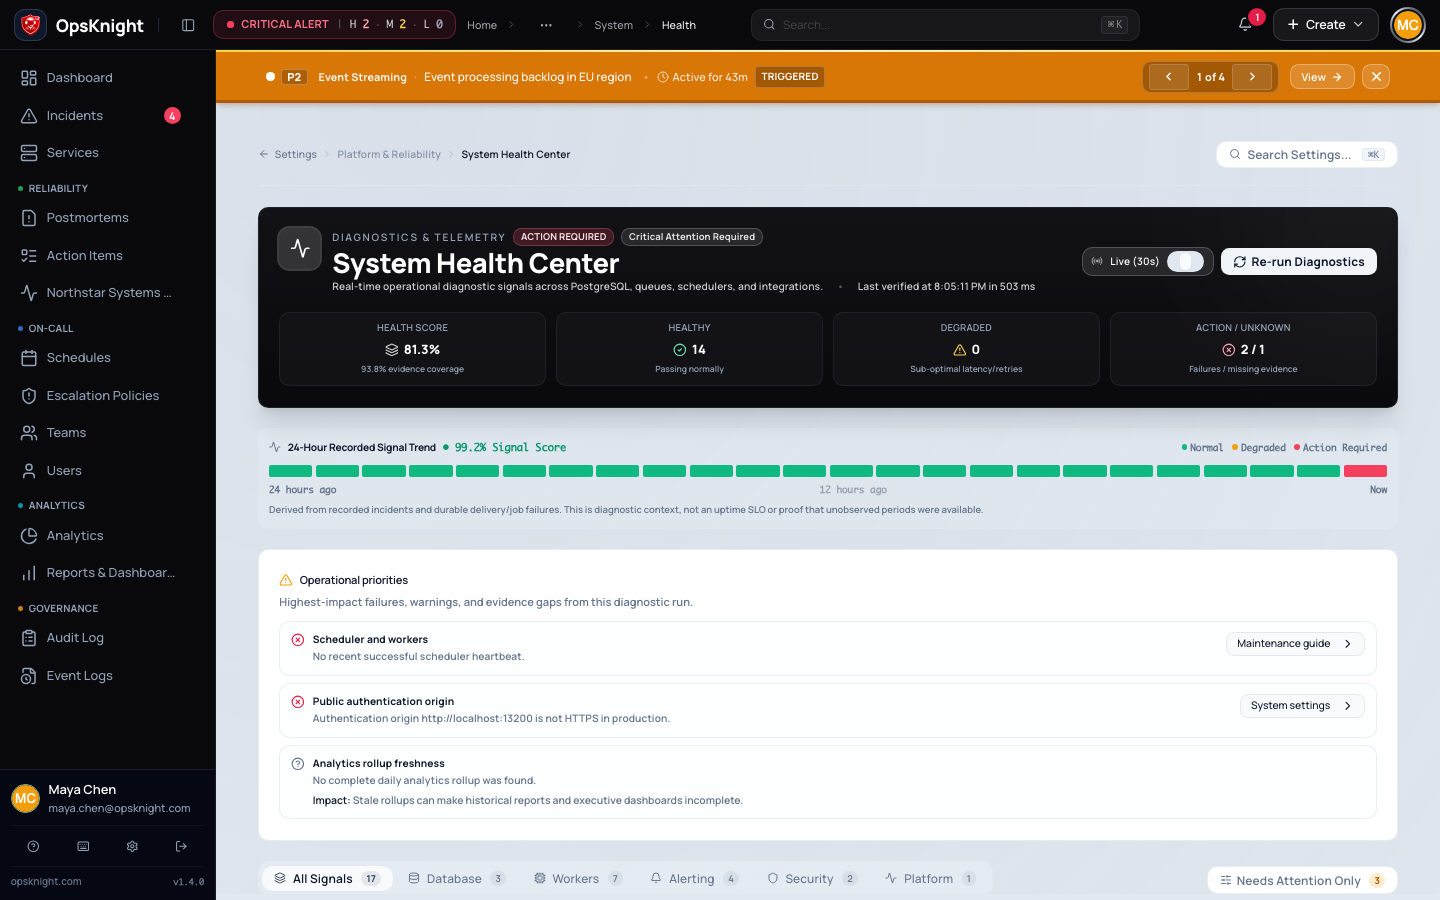
Before you begin
Sign in as an ADMIN, then identify the affected workflow, runtime role, and
time window. The page is at Settings → System → Health and is generated on
request; it is not a historical monitoring system.
Open the feature
Open Settings → System → Health. Record the UTC time, failed or unknown checks, and affected workflow before restarting anything.
Configure the diagnostic context
Open Prometheus and centralized logs for the same time window. Determine whether each check is cluster-wide, provider-scoped, or process-local; in split runtime, inspect the role that owns the work.
Understand how Health Center works
- Open the Health Center and inspect failed, warning, and unknown checks.
- Identify the owning dependency or runtime role.
- Correlate the check with metrics and system logs.
- Apply the relevant runbook and verify recovery with a synthetic workflow.
The Health Center summarizes application readiness and operational dependencies. Treat a green page as a point-in-time signal, not proof that delivery and paging workflows are healthy end to end. Each check declares its scope: cluster-wide database state, an external dependency, or only the replica serving the page.
Interpret statuses
- Healthy: the observed condition is within the check's current threshold.
- Degraded: the workflow may still operate, but backlog, latency, failures, or incomplete configuration needs attention.
- Unhealthy: a measured condition can prevent or materially delay work.
- Unknown: the collector had no data or could not read it. Unknown is not healthy; inspect the check details and cited dependency.
What the checks measure
- Database tests connectivity. Database capacity inspects connection use against configured/runtime capacity; neither proves query performance.
- Migrations compares committed and recorded migration state. Follow the
database-migration runbook before changing
_prisma_migrations. - Scheduler reads the singleton scheduler state and heartbeat. A current heartbeat proves only that its owner updated state, not that every job ran.
- Background jobs summarizes durable queue state and age. Inspect pending, processing, failed, and oldest work by lane before restarting workers.
- SLA query performance uses real calculation samples from the last hour or 24 hours. With no samples it reports unknown rather than running a synthetic query; p95 above 10 seconds or recent slow queries degrades the check.
- Escalation backlog counts escalation steps whose next timer is overdue.
- Paging configuration coverage finds services without a policy or whose policy has no steps. It does not send a page.
- Notification providers combines enabled provider configuration with delivery records, including failures in 24 hours and work pending over five minutes. Open Notification History for provider responses and retries.
- Inbound integrations uses process-local adapter metrics. Those counters reset on restart and are not cluster-aggregated; durable delivery state and logs remain authoritative.
- Public authentication origin compares application URL settings used by authentication. A healthy result does not test DNS, TLS, or every IdP.
- Encryption checks the configured encryption contract. It cannot prove that backed-up keys are recoverable.
- Version and upgrades reports the running version/update signal exposed to this replica; compare every replica and the deployed image digest.
- Analytics rollups checks the latest completed daily rollup.
- Integration delivery control plane detects stale durable external operations and inbound delivery leases plus recent terminal failures.
- Local durable-job worker and Realtime event control plane are replica-scoped. In a split deployment, absence on a web replica can be expected; verify the dedicated role separately.
Review database connectivity, migration state, scheduler heartbeat, worker lanes, queue age, and provider state. An unavailable critical worker or growing critical queue is more urgent than a delayed bulk lane. Use the linked health and metrics references for machine endpoints.
When a check fails, identify the owning runtime role, inspect its system logs, confirm configuration and network reachability, and then verify recovery with a synthetic workflow. Do not repeatedly restart a role without preserving the original failure evidence.
Common symptoms
- Everything is green but alerts do not arrive: send a synthetic provider event, then inspect inbound delivery, incident creation, paging coverage, notification history, and the relevant worker lane in order.
- Scheduler is healthy but jobs are old: the scheduler may be enqueueing correctly while a worker lane is absent, saturated, or repeatedly failing.
- A replica check changes on refresh: requests may be landing on different web replicas. Use instance-labelled Prometheus metrics and centralized logs.
- A check is unknown after upgrade: verify the database migration Job and permissions for the tables queried by Health Center before assuming no issue.
Verify recovery
Refresh until the owning check is healthy, then run the smallest synthetic workflow that proves the user outcome: ingest an alert, create or correlate an incident, deliver to a controlled destination, acknowledge, and resolve.
Undo the mitigation
Roll back temporary replica, concurrency, log-level, or provider-routing changes through their source of truth. Keep a mitigation only after its capacity and security effects are reviewed.
Troubleshooting
The result changes on refresh: requests are probably reaching different web replicas; use instance-labelled metrics and centralized logs.
Everything is green but delivery fails: inspect inbound integration, incident, paging coverage, notification operation, and provider outcome in order.
Unknown has no details: inspect the serving process logs and permissions for the underlying query; unknown is not healthy.
Next steps
Last updated for v2.0.0
Edit this page on GitHub