
Operate with system logs
Use OpsKnight's process-local log viewer and durable container logs without confusing them with audit history.
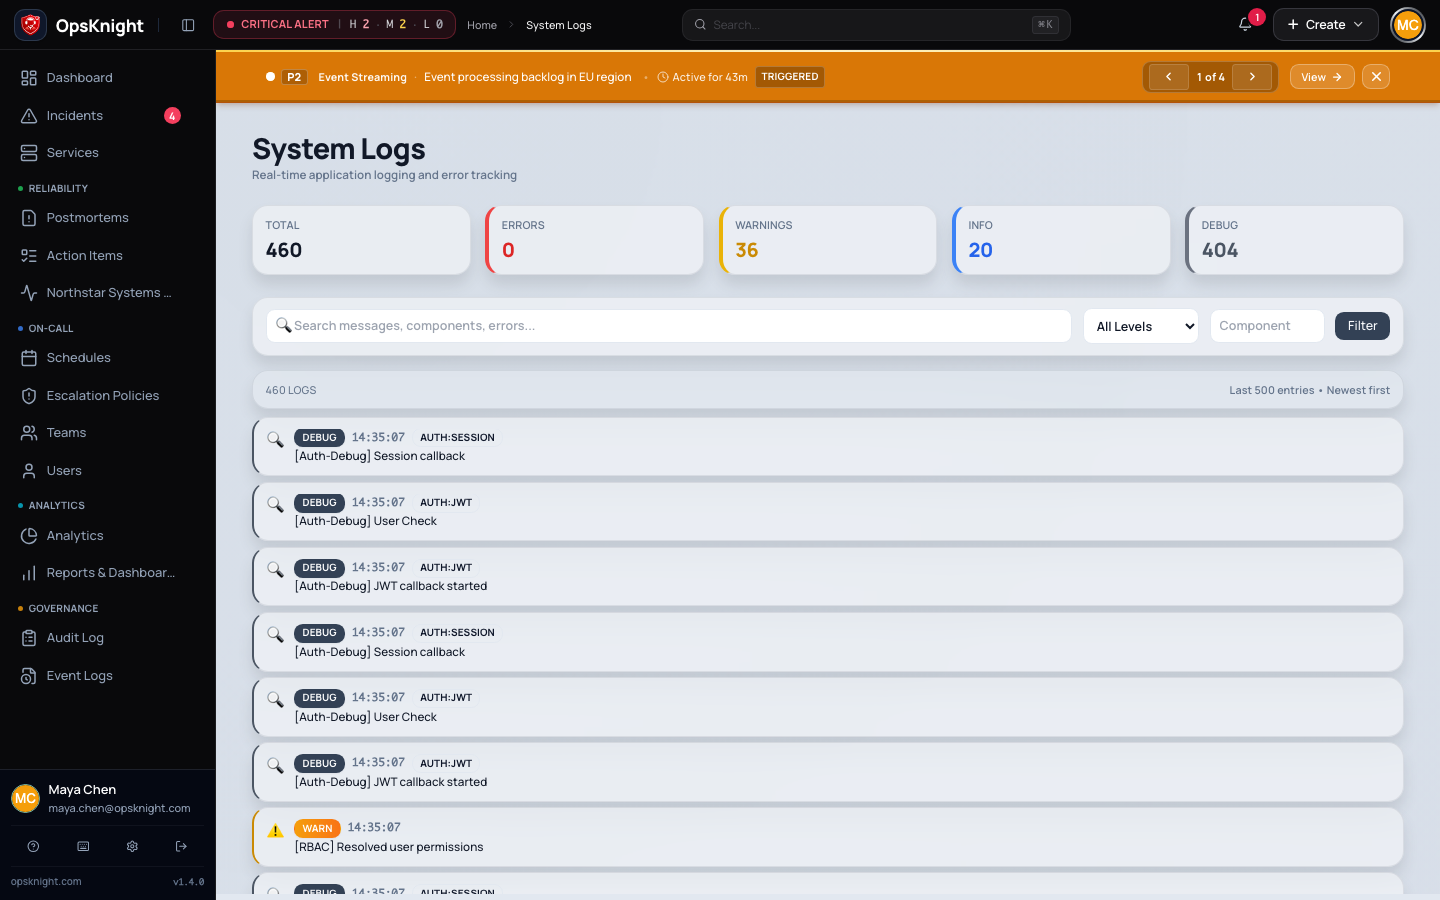
OpsKnight writes application logs to stdout/stderr and retains a small copy in each Node.js process. System Logs displays that in-process copy. Use it for immediate diagnosis on a single web replica; use your container logging platform for durable, searchable, multi-replica history.
Before you begin
Sign in as an ADMIN. Record the affected workflow, UTC time, visible error,
runtime role, and any request, incident, notification, delivery, or job identifier
before restarting a container or changing log levels.
Open the feature
Open System Logs (/system-logs) on the affected environment. Keep the platform log explorer open beside it because the UI buffer represents only the web process serving the request.
Understand how logging works
Supported boundary
- The page is available to
ADMINusers at System Logs (/system-logs). - Entries are newest first. The page requests at most 500 entries from the process serving that request.
- The buffer is memory-only. It is erased by a restart and is not shared between web, scheduler, or worker replicas.
- The page is not a durable audit record and does not prove that an event did or did not occur elsewhere in the cluster.
Use Audit Log for security-sensitive mutations, an incident timeline for lifecycle history, and notification delivery history for provider attempts.
Configure logging
Set these variables on every runtime role and restart that role:
LOG_LEVEL:debug,info,warn, orerror. The default isinfo.LOG_FORMAT:jsonfor structured output orprettyfor human-oriented local output. Production defaults to JSON; other environments default to pretty output.LOG_BUFFER_MAX: number of entries retained by each process. The default is 500, values above 5000 are capped at 5000, and0disables the in-process buffer without disabling stdout/stderr.
For production, keep JSON output and collect stdout/stderr with the platform agent: for example Fluent Bit or Promtail on Kubernetes, a Docker logging driver, or an agent shipping to Loki, Elastic, CloudWatch, or another protected log store. Apply access controls and retention appropriate for operational metadata.
Investigate an error
- Record the UTC time, visible error, affected incident or job identifier, and the
x-request-idresponse header when available. - Open System Logs on the web replica you are inspecting.
- Select Errors, Warnings, Info, or Debug, or use the level query parameter.
- Search message, component, or error text. The Component filter performs a case-insensitive partial match.
- Expand an entry to inspect its timestamp, component, request ID, user ID, duration, sanitized context, and error details when present.
- Search the same request ID or domain identifier in the central log store across web, scheduler, and worker roles.
- Confirm the diagnosis with queue state, provider delivery history, health checks, or metrics; do not infer cluster health from one process buffer.
OpsKnight accepts an incoming x-request-id only when it contains 1–128 letters, digits, dots, underscores, colons, or hyphens. Otherwise it creates a UUID. Background work may have no browser request ID, so correlate it with incident, notification, external-operation, or job identifiers.
Redaction and security
The logger redacts context keys associated with passwords, tokens, secrets, authorization, credentials, signatures, email, phone, sessions, cookies, JWTs, and webhook URLs. It also replaces recognized bearer/basic credentials, OpsKnight keys, Slack tokens, AWS access keys, email addresses, and sensitive URL query values inside strings.
Redaction is defense in depth, not permission to log secrets. Never add credentials or complete payloads to logs for troubleshooting. Restrict central logs because incident titles, identifiers, provider errors, and operational timing can still be sensitive.
Verify the diagnosis
Reproduce the safe test once, confirm the expected log transition across owning roles, and verify the user workflow recovers. Preserve relevant centralized records before a restart clears process-local evidence.
Undo temporary logging changes
Return LOG_LEVEL to the approved production value, roll the affected roles, and confirm debug volume stops. Do not reduce durable retention or delete incident evidence as part of cleanup.
Troubleshooting
The page says “No logs captured yet”
The current web process may have just restarted, LOG_BUFFER_MAX may be 0, or no entry at the active LOG_LEVEL has occurred. Check that replica's stdout/stderr and configuration.
An event appears in container logs but not in System Logs
It probably occurred in another replica or runtime role, fell out of the bounded buffer, or preceded a restart. Query the cluster-wide log store by request or domain identifier.
Debug messages are missing
Set LOG_LEVEL=debug on only the affected roles, restart them, reproduce for a short controlled period, and return to the normal level. Debug output can be high volume.
A request ID stops at the web tier
Follow the incident, notification, delivery, external-operation, or background-job identifier. Queue execution is asynchronous and is not guaranteed to retain the initiating browser correlation ID.
Next steps
Last updated for v2.0.0
Edit this page on GitHub