Create a dashboard
Create an operational dashboard from a blank canvas or a built-in template and verify its data.
Before you begin
Sign in and confirm you can read the teams, services, and incidents the dashboard should summarize. Dashboard metrics respect that authorization scope; creating a dashboard does not grant access to additional operational data.
Open the feature
Open Reports & Dashboards, then select Create Dashboard.
Configure the starting point
- Open Reports & Dashboards.
- Select Create Dashboard.
- Choose one starting point:
- Blank Dashboard creates an empty private dashboard for manual widget selection.
- Executive Summary emphasizes incident volume, active work, MTTR, SLA compliance, trends, insights, and service health.
- SRE Operations emphasizes active/unassigned incidents, coverage, escalations, response trends, urgency, calendar heatmap, on-call load, and noisy services.
- SLA Performance emphasizes acknowledgment/resolution compliance and breaches.
- Team Performance emphasizes team workload, response, resolution, and coverage.
- Minimal provides a small general-purpose starting set.
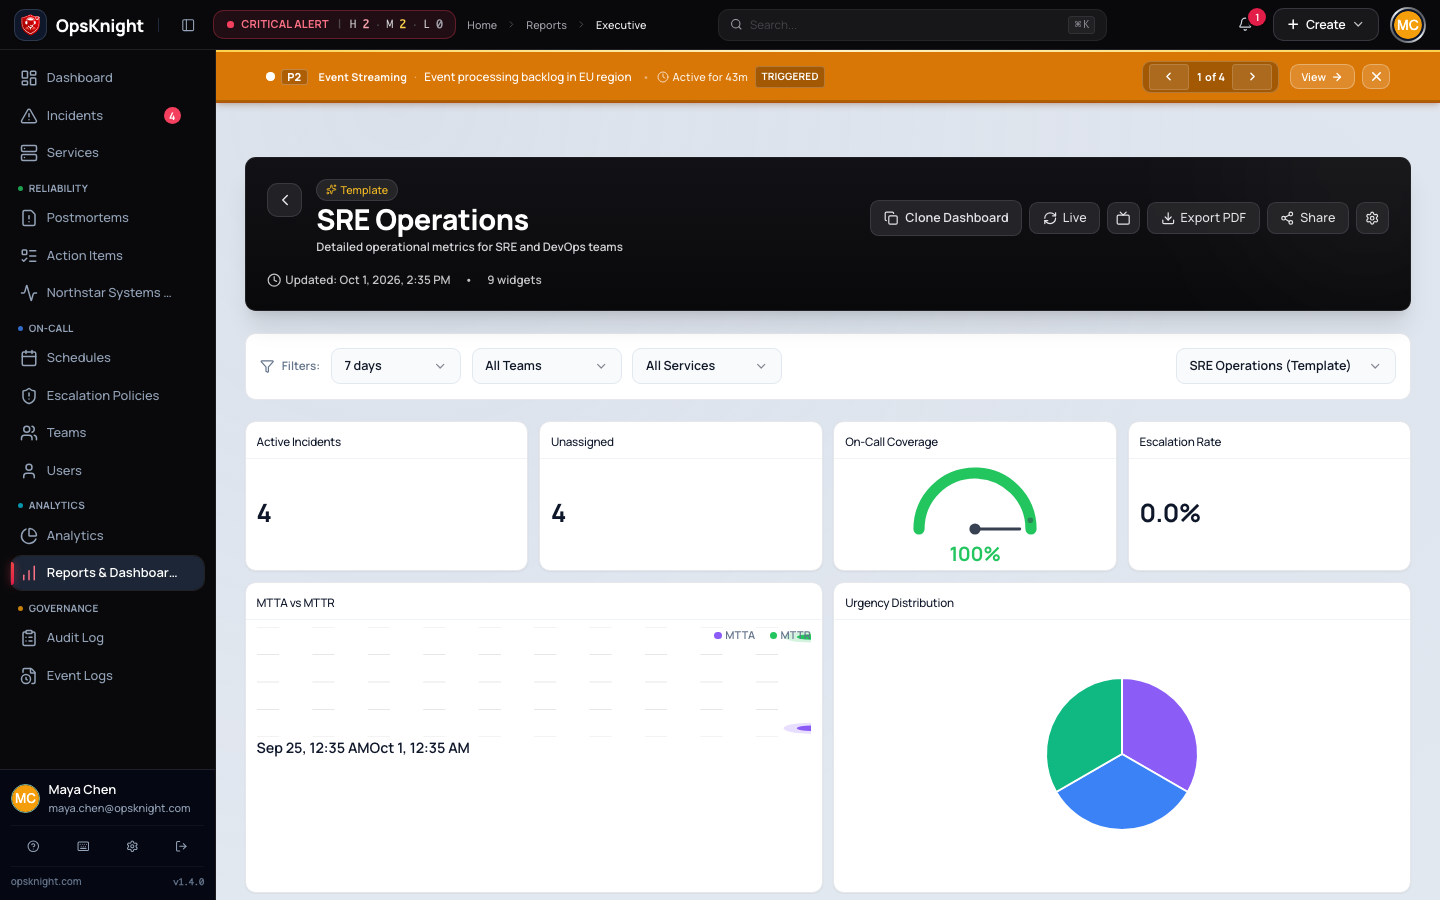
Selecting a template opens a live preview. It does not create a saved dashboard yet.
Create from a template
- Review the preview with the default seven-day, all-team, all-service scope.
- Change Time range, Team, or Service to verify the template answers the intended question.
- Select Clone Dashboard.
- Wait for navigation to the new saved dashboard.
- Open the settings menu and select Edit Dashboard.
- Replace the generated name and description with a purpose that states the audience and decision, for example
Payments weekly reliability review. - Add, remove, or reorder widgets as described in Manage a saved dashboard.
- Select Save Changes.
Success means the dashboard has a stable /reports/executive/<id> URL, appears under My Dashboards, and remains after a reload.
Create from scratch
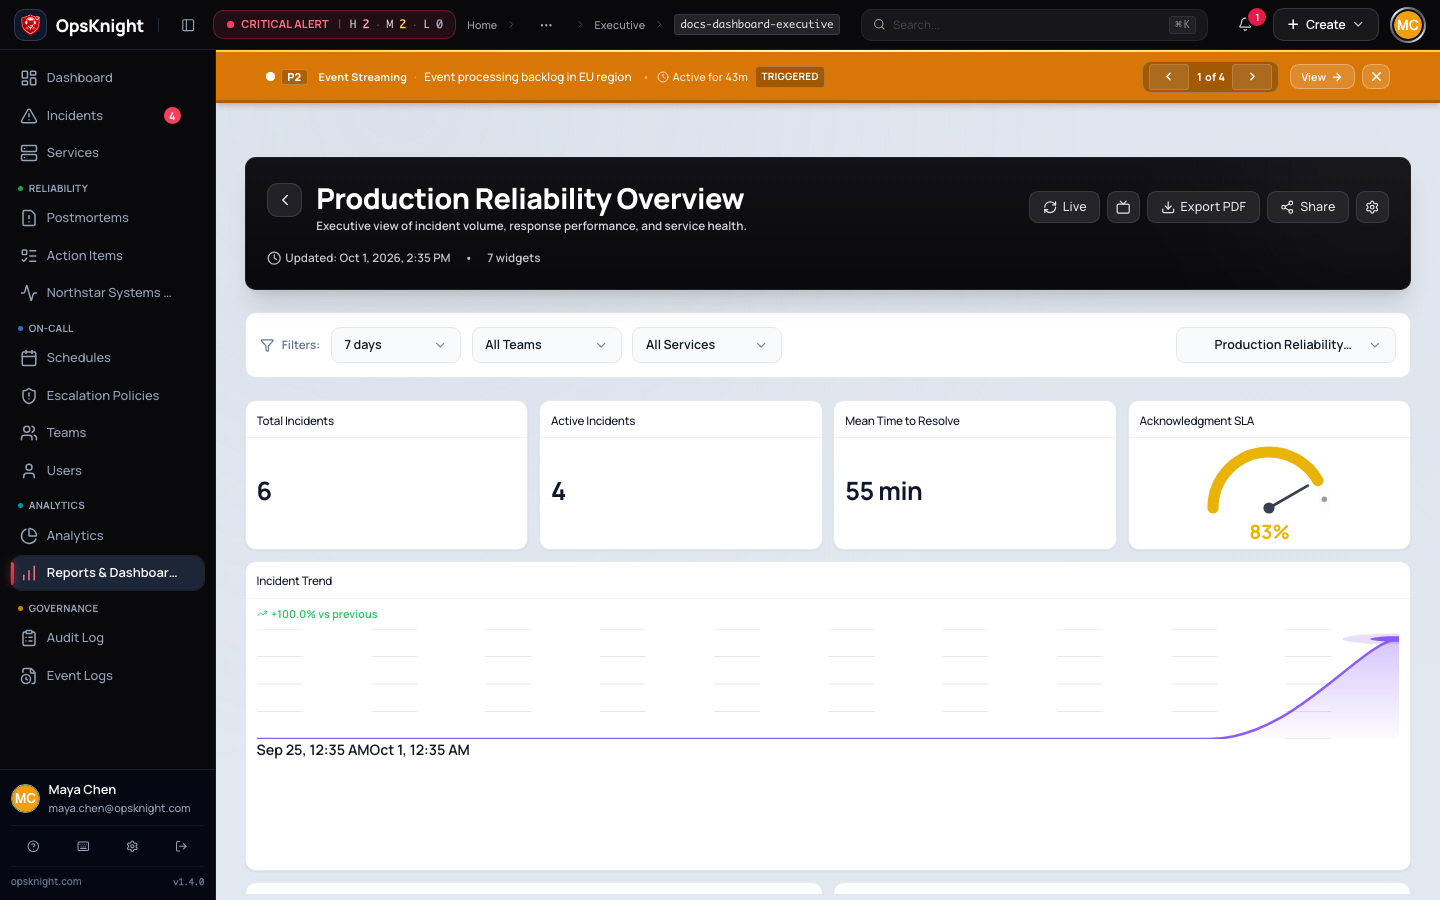
- On Create New Dashboard, select Create Blank Dashboard.
- The newly created private dashboard opens with no widgets.
- Select Add Widget.
- Search or filter the widget library by Metric Cards & Gauges, Charts & Graphs, Data Tables, or Special Widgets.
- Select each required widget once. A check mark means that widget definition is already present and cannot be added again.
- Select Done in the library, arrange the widgets, set the dashboard name and description, and select Save Changes.
Verify the result
Reload the page, then return to Reports & Dashboards. Confirm the card shows the expected name and widget count. Reopen it and verify the title, description, widget order, and widget set persisted. Change one filter and confirm the URL and displayed metrics update together.
If the dashboard is empty or a save fails, use Troubleshoot reports.
What OpsKnight does
OpsKnight creates a dashboard owned by the signed-in user and persists each widget's definition, metric, visual type, position, and configuration. Cloning copies a template into independent saved state; later template changes do not rewrite the clone.
Delete or replace the dashboard
To undo creation, open the saved dashboard, select the gear menu, and choose Delete Dashboard. To restart without losing the original immediately, create and verify the replacement first, then delete the obsolete dashboard.
Troubleshooting
- If cloning does not navigate to a saved URL, do not assume the dashboard exists; return to Reports and check My Dashboards.
- If a template is empty, clear filters and widen the time range.
- If saving is denied, confirm you own the saved dashboard.
Next steps
Last updated for v2.0.0
Edit this page on GitHub