
Review Event Logs
Search incident lifecycle events across services and correlate them with an incident timeline.
Before you begin
Use an administrator account and identify the incident, service, or approximate event time you need to investigate.
Open the feature
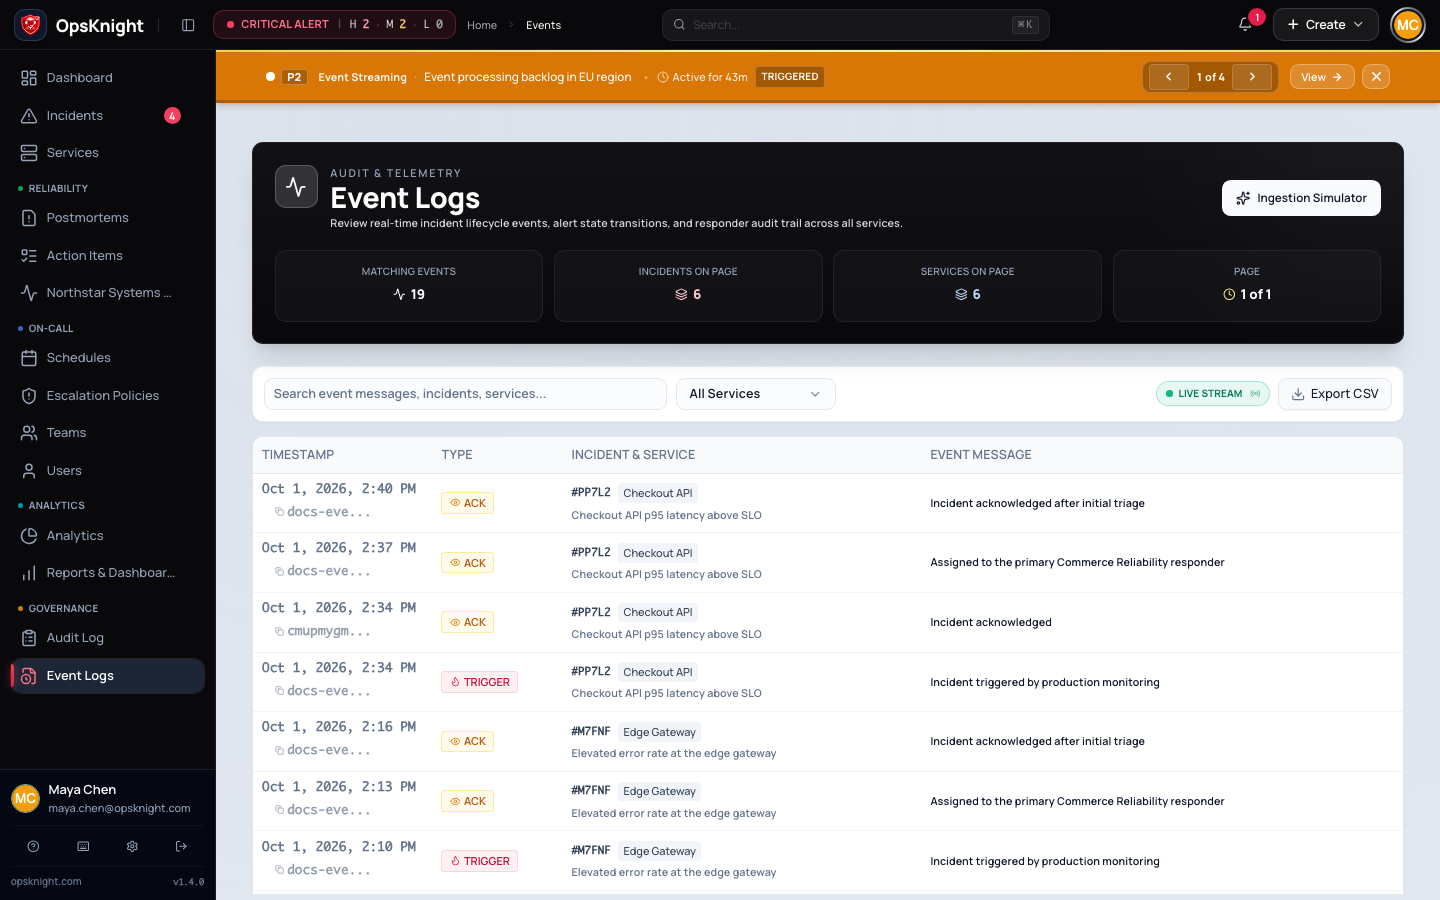
Event Logs are administrator-only incident telemetry. Open Event Logs to see newest-first lifecycle events across services. The header reports matching events, incidents and services on the current page, and pagination state.
- Search by event message, incident ID, incident title, or service name.
- Select a service to constrain results.
- Open the linked incident and compare the event time/message with its timeline.
- Move through pages when the expected event is older than the current 50-row page.
Configure search and filters
- Record incident ID, service, event timestamp, message, and filter scope when escalating a delivery or lifecycle problem.
Event Logs differ from Audit Logs: Event Logs explain incident lifecycle and alert transitions, while Audit Logs record administrative/entity actions. Use the Ingestion Simulator only for controlled testing; do not create synthetic events in production merely to investigate an existing incident.
How Event Logs works
The view reads newest-first incident events and applies search/service scope before paginating in pages of 50.
Verify the result
Open the linked incident and confirm event order and state agree with its timeline and current status.
Remove or clear filters
Clear search and service filters to return to all newest-first events.
Troubleshooting
An empty result usually means the search/service combination has no matching events or the event is on another page. Clear filters, search by exact incident ID, and verify the incident exists before treating the page as failed.
Next steps
Last updated for v2.0.0
Edit this page on GitHub