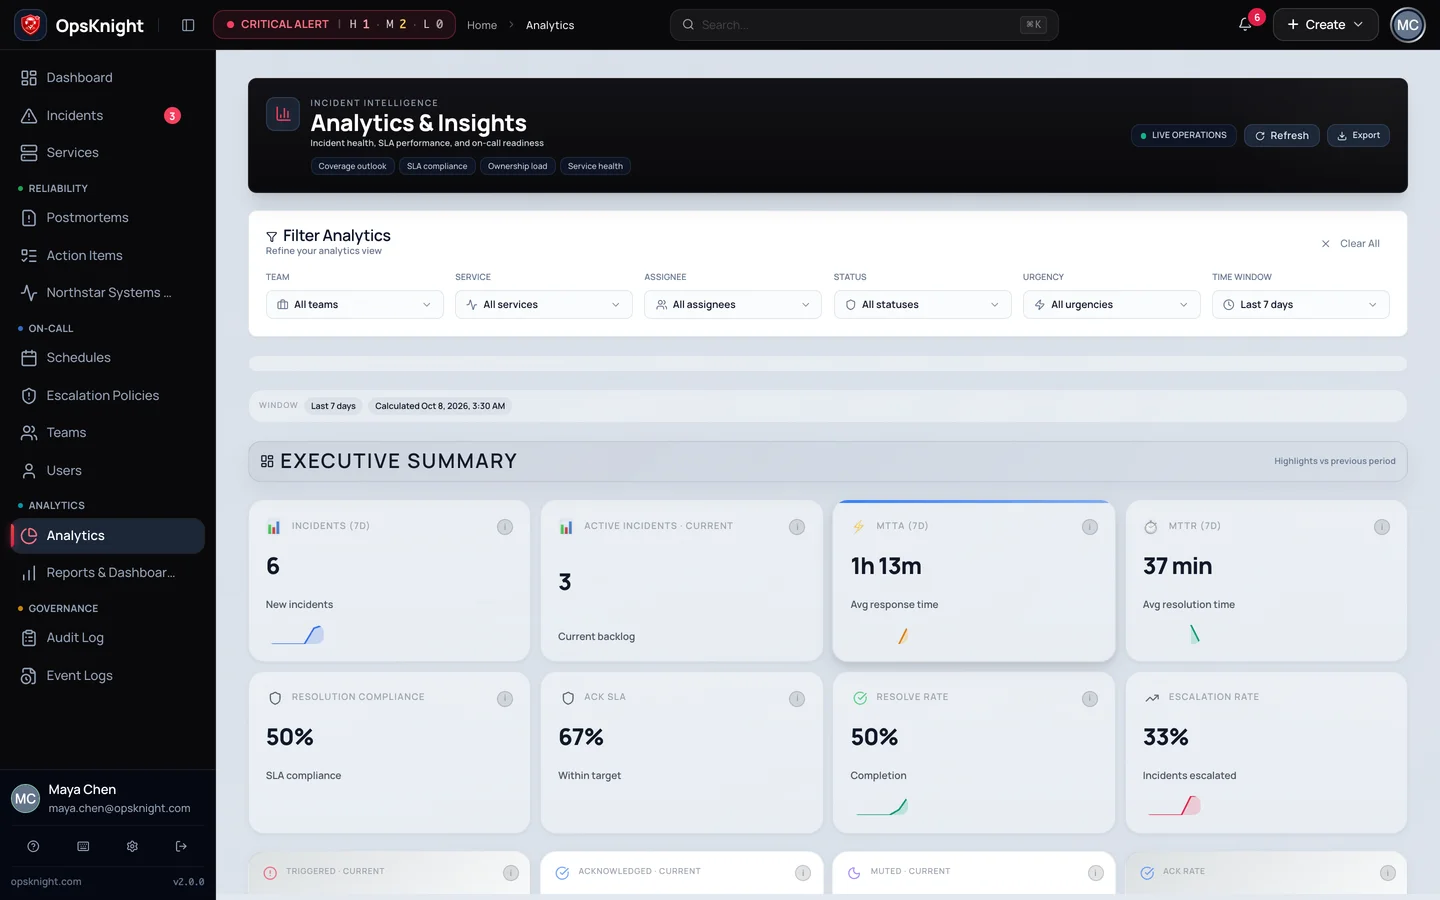
ANALYTICS

See the shape of your operations.

Use incident and service performance data to understand response times, trends and SLA outcomes.

WHAT IT SOLVES

Measure the response, not just the alert count.

Explore incident volume, acknowledgement and resolution timing with the available dashboard filters. Compare like-for-like time windows and service context.

Understand the capability
01MTTA and MTTR
02Incident volume and service trends
03Reports and configurable dashboards
OPSKNIGHT / PRODUCT VIEW Northstar Systems · v2.0.0
OpsKnight analytics product view

HOW IT WORKS

A concrete operational path, not a feature list.

RESPONSE MEASUREMENTKeep timing metrics attached to the population and filters that produced them.
01MTTA
02MTTR
03Incident volume
04SLA
Time windowService scopeSource incidents

EXPLORE A WORKFLOW

  1. 01Select time window
  2. 02Filter population
  3. 03Inspect MTTA
  4. 04Inspect MTTR

Timing metrics only make sense with the selected incident population and time window visible. Use them to identify a pattern, not to infer root cause automatically.

OPERATIONAL DEPTH

Analytics, beyond the happy path.

The details below are the parts teams need when evaluating how the capability behaves during real response, failure, and handoff.

01

Keep current state and historical timing distinct.

An active incident count describes the current response. MTTA and MTTR describe timing across the selected population; inspect the sample and filters before drawing conclusions.

Read the operational guide
02

Bring the questions back to the team.

Use the analysis to identify repeated incidents and response bottlenecks, then connect findings to owned postmortem action items. Metrics support investigation rather than explaining root cause on their own.

Read the operational guide
03

Verify the evidence behind a review.

Record the selected time range and service scope when sharing a finding. Follow the analytics guide to understand available views and operational limitations.

Read the operational guide

KNOW BEFORE PRODUCTION

Validate the boundary, not just the happy path.

Use a test service and representative provider configuration before treating analytics as production incident infrastructure.

  1. 01Record the selected time window and service scope with every shared metric.
  2. 02Verify the MTTA or MTTR population before drawing conclusions from the number.
  3. 03Open the source incidents or postmortems before turning a pattern into a root-cause claim.
DOCUMENTATIONSetup, authorization, limits, and troubleshooting.
Explore analytics documentation

Your incidents should belong to you.

Run OpsKnight on infrastructure you control.

v2.0.0 · AGPL-3.0-only · Self-hosted · 28 inbound integrations