Services
Centralized service registry for health monitoring, ownership, and incident routing
Services
Services are the foundation of OpsKnight's incident management model. They represent the components of your infrastructure — APIs, databases, microservices, and applications — that can experience incidents. Every incident is linked to a service, enabling clear ownership, proper routing, and meaningful analytics.
Why Services Matter
| Without Services | With Services |
|---|---|
| Alerts are orphaned with no context | Every incident has a home |
| Unclear who owns what | Clear team ownership |
| No way to prioritize | SLA tiers guide response |
| Incidents go to everyone | Targeted escalation routing |
| No health visibility | Real-time service health dashboard |
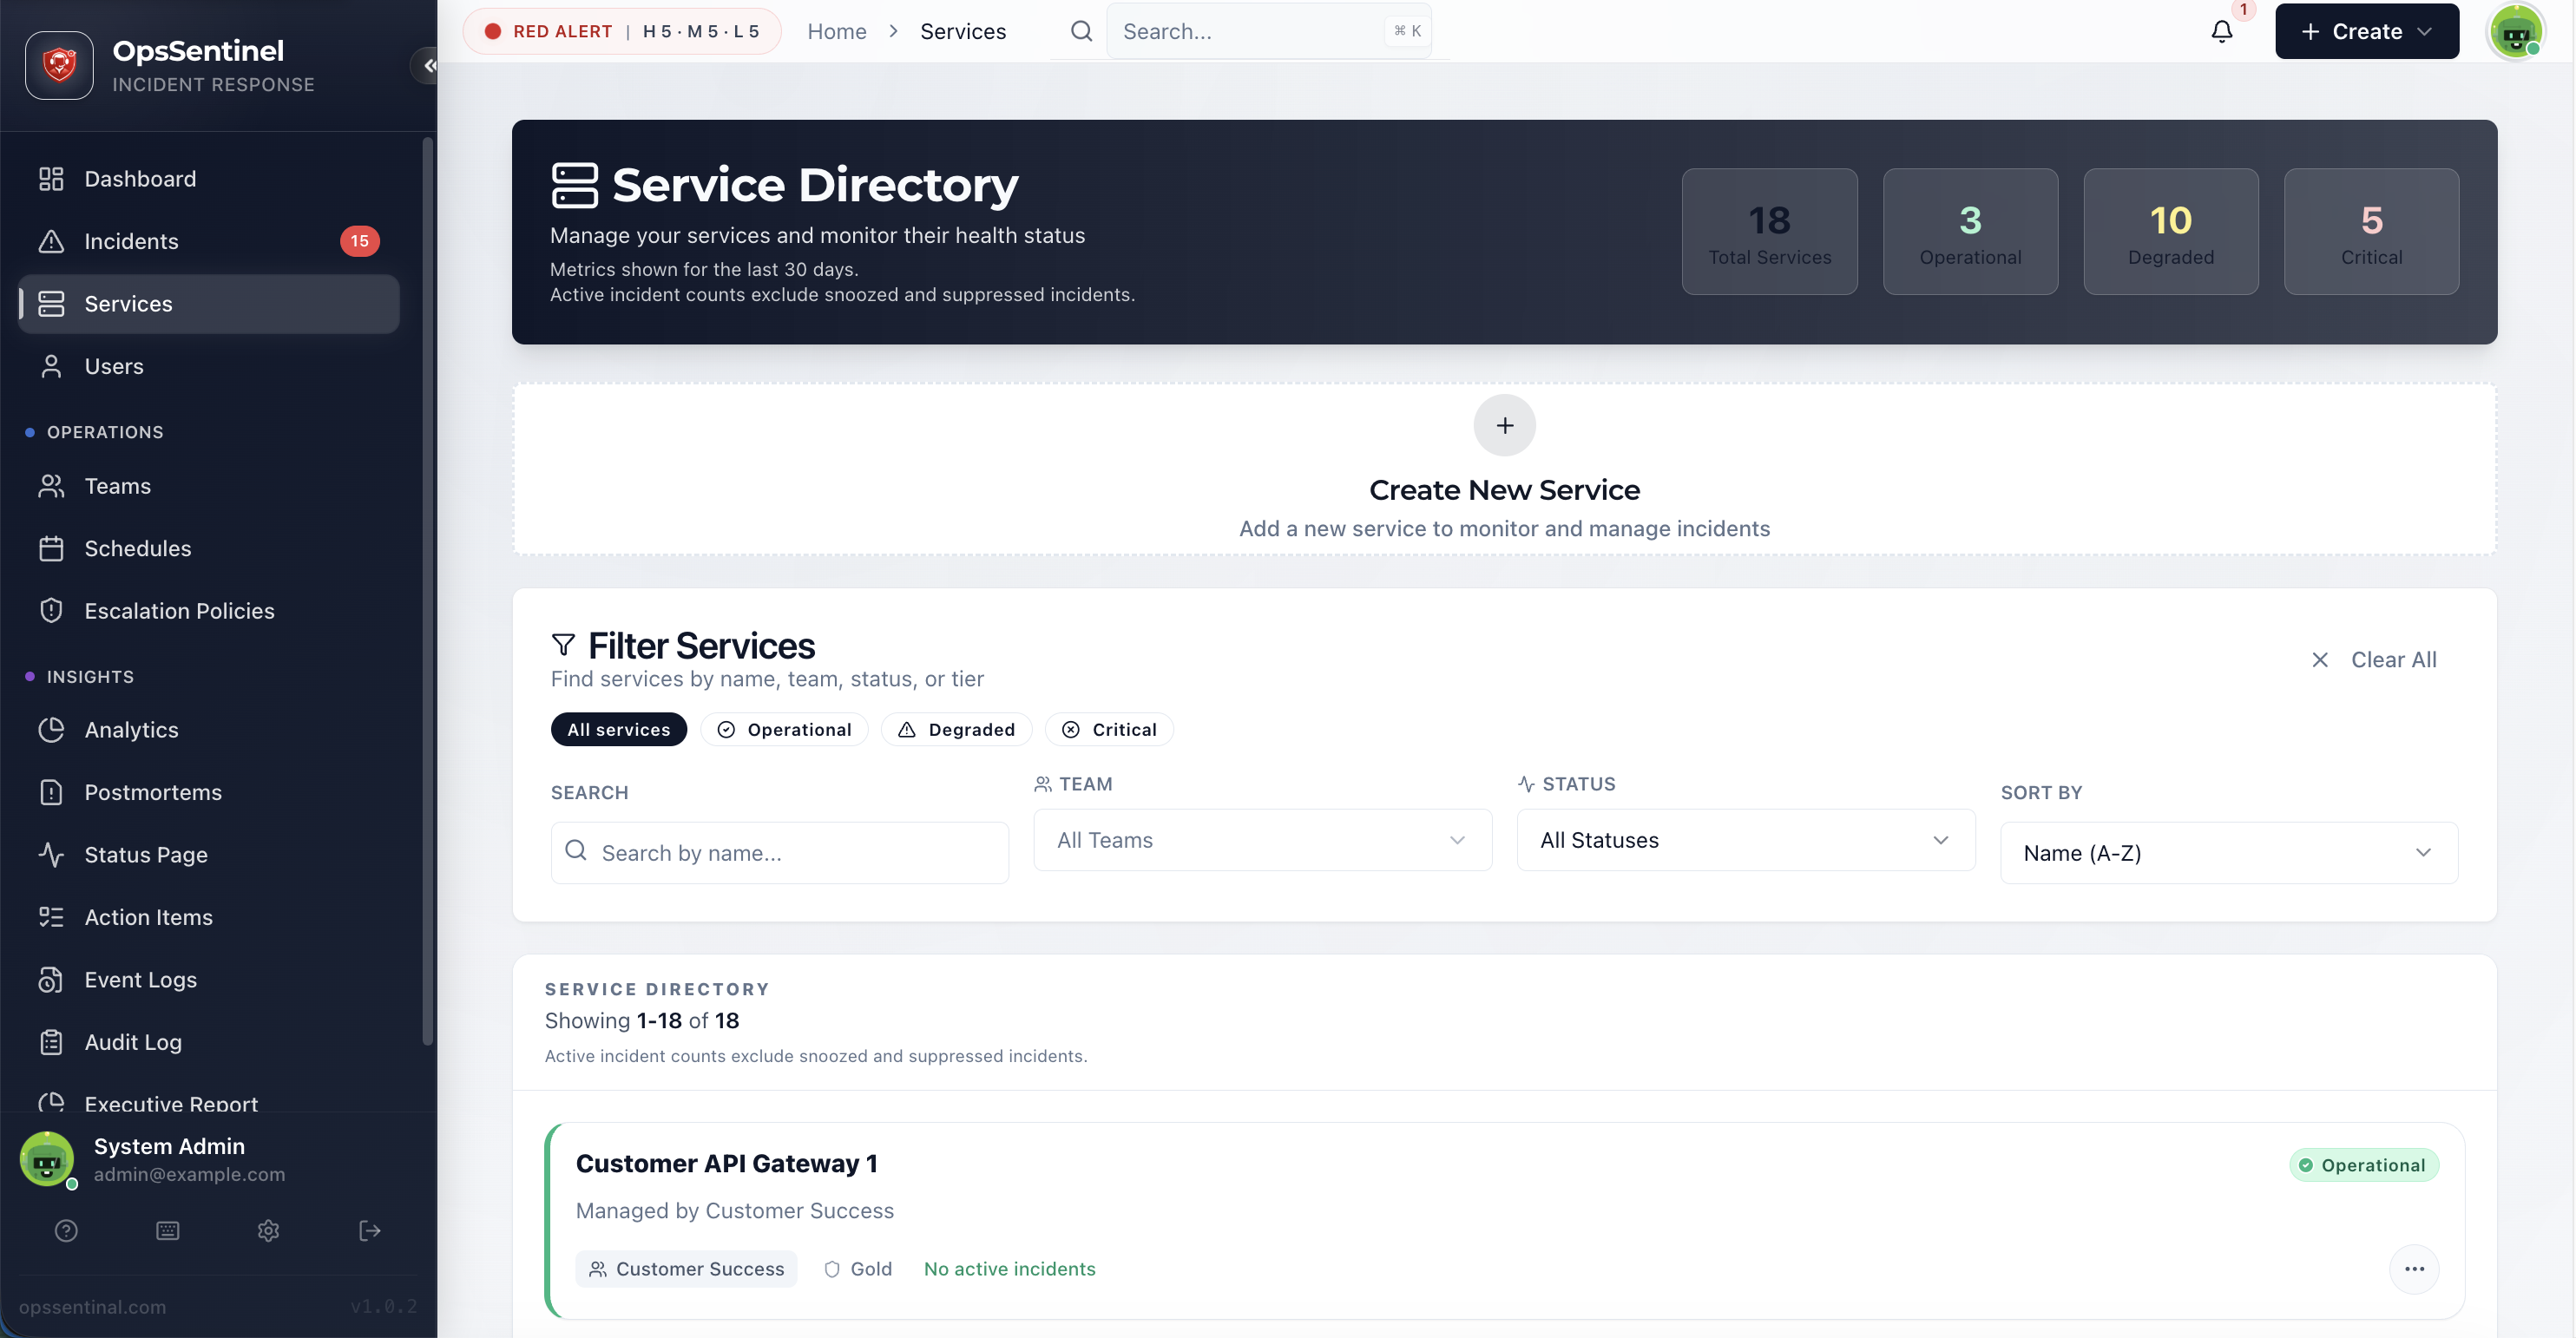
Service Directory
The Service Directory is your centralized registry of all monitored components.
Accessing the Directory
- Click Services in the sidebar
- View the service list with health indicators
- Use filters to find specific services
Directory Overview
The top panel provides an immediate SITREP (Situation Report):
| Metric | Description |
|---|---|
| Total Services | Complete count of registered services |
| Operational | Services with no active incidents |
| Degraded | Services with non-critical active incidents |
| Critical | Services with HIGH urgency active incidents |
Service Health Status
Service health is calculated dynamically based on active incidents.
Health States
| Status | Visual | Condition | Action |
|---|---|---|---|
| Operational | 🟢 Green | No active incidents | None needed |
| Degraded | 🟡 Yellow | Active LOW/MEDIUM incidents | Monitor closely |
| Critical | 🔴 Red | Active HIGH urgency incident | Immediate response |
Health Calculation Logic
IF any active HIGH urgency incident → CRITICAL
ELSE IF any active incident → DEGRADED
ELSE → OPERATIONAL
Notes:
- Snoozed incidents don't affect health status
- Suppressed incidents don't affect health status
- Health updates in real-time as incidents change
Status on Service Cards
Each service card displays:
- Left border color — Quick visual health indicator
- Status badge — Current health state
- Incident count — Number of active incidents
- Region — Deployment region (if configured)
- SLA Tier — Service criticality level
Service Fields
Required Fields
| Field | Description | Example |
|---|---|---|
| Name | Unique service identifier | payment-api |
| Owner Team | Team responsible for this service | Platform Engineering |
Optional Fields
| Field | Description | Example |
|---|---|---|
| Description | Brief explanation of the service's purpose | Handles all payment processing |
| Region | Deployment location | us-east-1, eu-west-1 |
| SLA Tier | Criticality/SLA level | Platinum 99.99%, Gold 99.9% |
| Escalation Policy | Policy for incident routing | Payment API Escalation |
| Slack Channel | Channel for this service's alerts | #payment-alerts |
| Runbook URL | Link to operational documentation | https://wiki.example.com/payment-api |
| Repository URL | Link to source code | https://github.com/company/payment-api |
| Dashboard URL | Link to monitoring dashboard | https://grafana.example.com/payment |
Creating a Service
Via Web UI
- Go to Services in the sidebar
- Click Create Service
- Fill in the required fields:
- Name: Unique, descriptive name
- Owner Team: Select from existing teams
- Configure optional fields as needed
- Click Create
Service Naming Best Practices
| Pattern | Example | Why |
|---|---|---|
| Component-based | payment-api, user-service |
Clear purpose |
| Environment-prefixed | prod-payment-api |
Distinguishes environments |
| Team-prefixed | platform-kafka |
Shows ownership |
Avoid:
- Generic names (
api,service) - Abbreviations that aren't universal (
pmt-svc) - Special characters (stick to letters, numbers, hyphens)
Initial Setup Checklist
After creating a service:
- Assign escalation policy
- Set SLA tier (if applicable)
- Add integrations (monitoring tools)
- Configure Slack channel (if using Slack)
- Add runbook URL
- Link to dashboards/repositories
Service Detail Page
Click any service to open its detail page with full information and actions.
Header Section
- Service name and description
- Health status badge
- Quick actions: Edit, View Incidents, Settings
Properties Panel
| Property | Description |
|---|---|
| Owner Team | Team responsible (links to team page) |
| Escalation Policy | Active policy (links to policy page) |
| Region | Deployment region |
| SLA Tier | Service tier with uptime target |
| Created | When the service was created |
| Last Incident | Most recent incident timestamp |
Active Incidents
List of currently open incidents for this service:
- Incident title and urgency
- Current status
- Assignee
- Time since triggered
Recent Incidents
Historical incidents with:
- Incident title
- Resolution status
- MTTR for this incident
- When it occurred
Metrics
Service-level metrics over time:
- Incident count (30/60/90 days)
- MTTA (Mean Time to Acknowledge)
- MTTR (Mean Time to Resolve)
- Uptime percentage
Service Configuration
Escalation Policy Assignment
Link an escalation policy to determine who gets notified:
- Open service detail page
- Click Edit or go to Settings
- Select Escalation Policy from dropdown
- Save changes
What happens:
- New incidents trigger this policy
- Existing incidents continue with their assigned policy
SLA Tier Configuration
Set the service's SLA tier for reporting and prioritization:
| Tier | Typical Uptime | Use Case |
|---|---|---|
| Platinum | 99.99% | Customer-facing critical systems |
| Gold | 99.9% | Important production services |
| Silver | 99.5% | Internal tools, non-critical |
| Bronze | 99.0% | Development, low-priority |
- Open service settings
- Select SLA Tier
- Save
SLA tiers affect:
- SLA breach calculations
- Reporting categorization
- Prioritization suggestions
Slack Channel Routing
Route this service's alerts to a specific Slack channel:
- Open service settings
- Enter Slack Channel name (e.g.,
#payment-alerts) - Save
Behavior:
- Incidents for this service post to this channel
- If not set, uses organization default channel
Service Integrations
Services connect to monitoring tools via integrations.
Linking an Integration
- Open the service
- Go to Integrations tab
- Click Add Integration
- Select integration type (Datadog, Prometheus, etc.)
- Configure integration settings
- Save
Integration Types
| Type | Purpose |
|---|---|
| Datadog | Receive alerts from Datadog monitors |
| Prometheus | Receive alerts from Alertmanager |
| Grafana | Receive alerts from Grafana alerts |
| Custom Webhook | Generic HTTP integration |
Each integration gets a unique routing key that directs incoming alerts to this service.
Multiple Integrations
A service can have multiple integrations:
- Different monitoring tools
- Different alert sources
- Test vs. production alerts
Service Ownership
Team Ownership
Every service must have an owner team:
- Single owner — One team per service (no shared ownership)
- Clear accountability — Team receives escalations
- Team page shows services — Team members see their services
Transferring Ownership
To change a service's owner:
- Open service settings
- Change Owner Team dropdown
- Save
Considerations:
- New team takes over future incidents
- Historical incidents retain original team context
- Ensure new team has appropriate escalation policy
Orphaned Services
Services without valid teams (team deleted):
- Show warning indicator
- Should be reassigned immediately
- May affect incident routing
Filtering & Search
Search
Type in the search box to filter by:
- Service name
- Description text
Team Filter
Filter services by owner team:
- Click Team dropdown
- Select one or more teams
- View only their services
Status Filter
Filter by health status:
- All — Show all services
- Critical — Only critical services
- Degraded — Only degraded services
- Operational — Only healthy services
Sorting Options
| Sort | Description |
|---|---|
| Name (A-Z) | Alphabetical order |
| Name (Z-A) | Reverse alphabetical |
| Status (Health) | Critical → Degraded → Operational |
| Most Incidents | Noisiest services first |
| Recently Created | Newest services first |
Service Cards
The list view uses cards optimized for quick scanning.
Card Elements
┌────────────────────────────────────────────────┐
│ 🟢 Payment API                         us-east-1 │
│    Handles payment processing                    │
│    ─────────────────────────────────────────────│
│    Platform Engineering  │  Gold  │  0 incidents │
└────────────────────────────────────────────────┘
| Element | Description |
|---|---|
| Color bar | Left border indicates health |
| Name | Service name (bold) |
| Region | Deployment region badge |
| Description | Service purpose |
| Team | Owner team |
| SLA Tier | Service tier badge |
| Incident count | Active incident count |
Card Interactions
- Click card — Open service detail page
- Hover — Shows loading state before navigation
Service Metrics
Uptime Calculation
Uptime is calculated based on incident duration:
Uptime % = (Total Minutes - Incident Minutes) / Total Minutes × 100
What counts as downtime:
- Active incidents (OPEN, ACKNOWLEDGED)
- Does NOT count: SNOOZED, SUPPRESSED, RESOLVED
MTTA (Mean Time to Acknowledge)
Average time from incident creation to acknowledgment:
MTTA = Sum(Ack Time - Create Time) / Count of Acknowledged Incidents
MTTR (Mean Time to Resolve)
Average time from incident creation to resolution:
MTTR = Sum(Resolve Time - Create Time) / Count of Resolved Incidents
Viewing Metrics
- Open service detail page
- Scroll to Metrics section
- Select time range (7d, 30d, 90d)
Metrics are also available via:
- Analytics dashboard (filtered by service)
- API (
/api/services/{id}/metrics)
API Access
List Services
GET /api/services
Get Service
GET /api/services/{id}
Create Service
POST /api/services
Content-Type: application/json

{
  "name": "payment-api",
  "description": "Payment processing service",
  "teamId": "team_123",
  "region": "us-east-1",
  "slaTier": "GOLD"
}
Update Service
PATCH /api/services/{id}
Content-Type: application/json

{
  "description": "Updated description",
  "escalationPolicyId": "policy_456"
}
Troubleshooting
Incidents Not Routing to Service
- Verify integration is linked to service
- Check integration routing key is correct
- Verify escalation policy is assigned
- Test with a manual incident
Service Showing Wrong Status
- Check for active incidents (including snoozed)
- Verify incident urgency levels
- Refresh the page
- Check for stale cached data
Can't Delete Service
- Check for active incidents (must be resolved)
- Verify you have admin permissions
- Check for dependent configurations
Related Topics
- Incidents — Incident management
- Teams — Team ownership
- Escalation Policies — Alert routing
- Integrations — Connecting monitoring tools
- Analytics — Service-level metrics
Last updated for v1
Edit this page on GitHub